Stakeholder engagement is more strategic and data-driven than ever, and the key to sustained project and organisational success lies in measurement. But which stakeholder engagement metrics actually matter? How can robust KPIs, platform analytics, and industry benchmarks inform decision-making and drive stakeholder success measurement? This comprehensive guide, based on best-practice expertise and the latest trends, explores in depth the art and science of stakeholder engagement KPIs—including actionable methods for deriving them, interpreting analytics, and benchmarking for true stakeholder impact.
—
Understanding Stakeholder Engagement Metrics and Their Critical Role
Stakeholder engagement metrics are quantifiable indicators used to assess the effectiveness, depth, and impact of your stakeholder interactions. They bridge the gap between effort and outcome, providing transparency and driving continuous improvement.
Why Metrics and KPIs Matter in Stakeholder Management
- Decision Support: Analytical KPIs help leaders prioritise resources and refine strategies.
- Trust and Accountability: Objective measurement builds transparency, supporting trust and transparency between organisations and stakeholders.
- Continuous Improvement: Real-time feedback via analytics shortens feedback loops, enabling agile adjustments to engagement initiatives.
- Stakeholder-Centric Culture: Metrics reveal what works for specific audiences, helping tailor communications and engagement approaches.
Distinguishing Metrics from KPIs
A metric is any quantifiable measure; a KPI (Key Performance Indicator) is a critical measure tied directly to your organisation’s most important goals. Not all metrics are KPIs, but all KPIs are metrics.
—
The Most Meaningful Stakeholder Engagement KPIs: What to Track and Why
Selecting the right KPIs requires a nuanced understanding of your project goals, stakeholder mix, and engagement channels. Here are the categories and specific examples experts consider most impactful:
1. Engagement Volume and Reach
- Number of Stakeholders Engaged: Total active participants—reveals your engagement scale.
- Stakeholder Demographic Breakdown: Measures inclusivity; ensures underrepresented groups are not missed.
- Channel-Specific Reach: Compares touchpoints (events, emails, online forums) for optimal channel mix.
2. Depth and Quality of Engagement
- Average Participation Rate: Proportion of stakeholders responding to surveys, forums, meetings, or consultations.
- Repeat Engagement Rate: Frequency of stakeholder return—crucial for tracking stakeholder relationship health and advocacy development.
- Sentiment Score: Uses qualitative analysis (e.g. AI-driven sentiment analysis or structured feedback) to gauge tone and content of stakeholder communications.
3. Responsiveness and Resolution Metrics
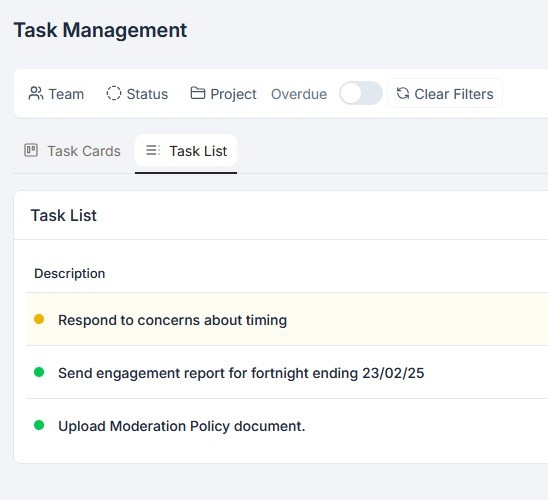
- Average Response Time: Measures how quickly teams respond to stakeholder queries or feedback.
- Resolution Rate: Proportion of issues or questions resolved within a defined timeframe.
- Feedback Loop Closure: Tracks how consistently responses are delivered back to stakeholders, demonstrating organisational accountability.
4. Satisfaction, Perception, and Impact
- Stakeholder Satisfaction Score (SSS): Directly polled via surveys after key interactions.
- Net Promoter Score (NPS): Measures likelihood that stakeholders advocate for your organisation or project—a powerful proxy for trust and loyalty.
- Impact Metrics: Tracks perceived or actual changes resulting from stakeholder input (e.g. policy adjustments, project redesigns).
5. Inclusivity and Accessibility
- Accessibility of Platforms: Percentage of engagement interfaces meeting accessibility standards—see also benefits of accessibility and inclusivity.
- Representation Across Demographics: Ensures engagement is not only broad, but equitably distributed.
—
Deriving Stakeholder KPIs from Platform Analytics
Modern stakeholder engagement platforms capture a wealth of analytics—from system-generated event logs to sophisticated AI-driven analysis. Translating this data into actionable metrics requires expertise and intentionality.
Essential Steps to KPI Derivation
- Identify Critical Success Outcomes: Begin with clarity on what success looks like—e.g. improved stakeholder trust, higher advocacy, successful project delivery.
- Map Analytics to Objectives: Align platform data points (logins, document downloads, forum posts, sentiment indicators) to key outcomes. For example, increased document downloads could indicate rising stakeholder interest and information-seeking.
- Establish KPI Formulas and Thresholds: Use analytics dashboards to create custom reports (e.g. calculating participation rates as number of survey respondents divided by total invited participants).
- Set Regular Review Cadence: Periodic analysis (monthly, quarterly) enables trend spotting and timely intervention.
Examples: Platform Analytics to KPI Conversion
- Metric: Number of attendees at stakeholder briefings.
KPI: 80% attendance of all key stakeholder groups at every major project milestone. - Metric: Time taken to acknowledge incoming stakeholder concerns (from platform logs).
KPI: 95% of stakeholder queries acknowledged within 48 hours. - Metric: Count of unique stakeholder comments on discussion forums.
KPI: 20% increase in high-quality, constructive input across forums over previous quarter.
The Power of Integrated Analytics
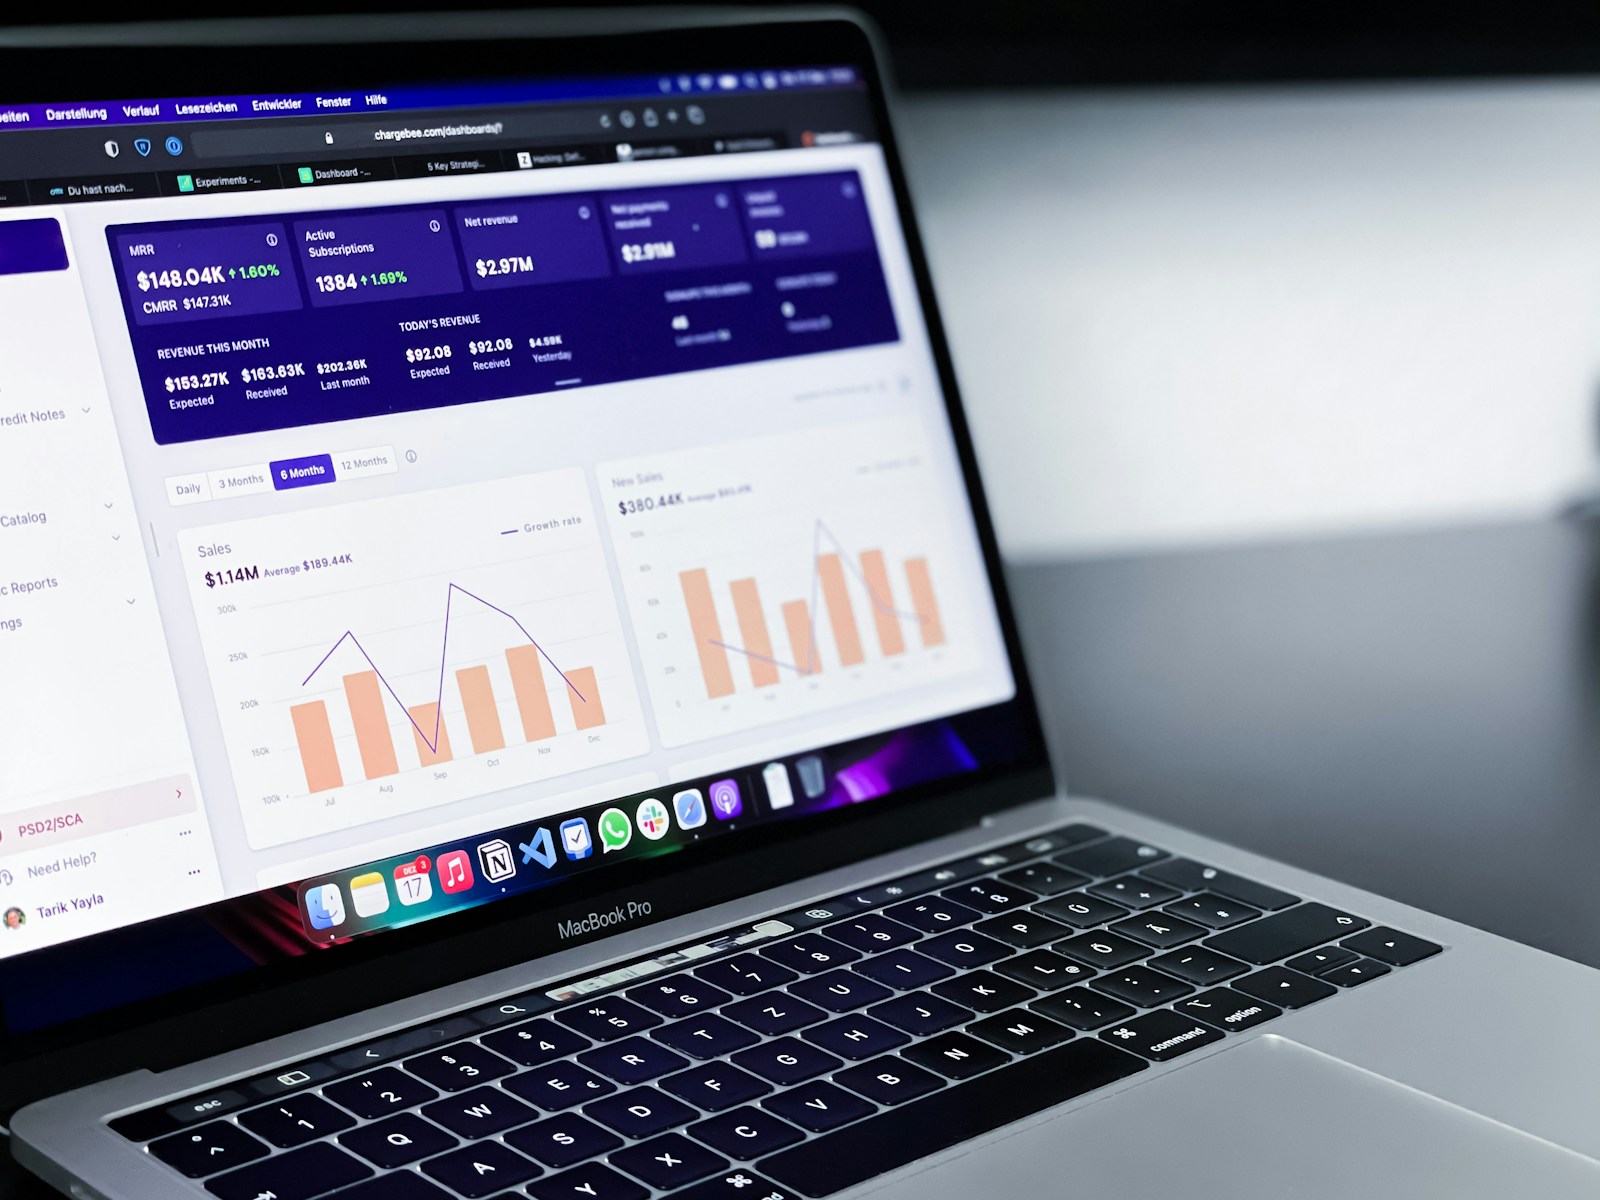
Platforms purpose-built for engagement (like Quicker) offer advanced reporting features that aggregate qualitative and quantitative data, driving evidence-based engagement strategy. Automated tagging, AI sentiment analysis, and customisable dashboards are critical for surfacing insights that inform and optimise stakeholder success measurement.
For a deep dive into how reporting and analytics can transform engagement, see the robust tools available in our reporting and analytics category.
—
Industry Benchmarks for Stakeholder Success Measurement: Setting the Bar
Measurable KPIs are most valuable when compared against clear targets or industry benchmarks. But what is considered “good” stakeholder engagement? The answer varies by sector, project type, and stakeholder complexity, but several established standards can serve as touchstones.
Typical Benchmarks by Engagement Metric
- Stakeholder Participation: In high-interest settings (government, infrastructure, major resources), 60–80% participation from key groups is considered strong. In lower-touch projects, 25–40% may be realistic.
- Repeat Engagement: More than 50% repeat involvement signals genuine relationship building.
- Satisfaction (via Survey): Average stakeholder satisfaction scores above 80% reflect highly effective engagement.
- Response Times: Acknowledging feedback within 48 hours and providing substantive responses within five business days is generally seen as industry-leading.
- NPS Benchmarks: Scores higher than 30 are viewed favourably in community, healthcare, and infrastructure engagement settings.
- Representation: Proportional representation of minority and marginalised groups is a critical benchmark for inclusivity.
How to Set and Use Benchmarks
- Industry Comparisons: Compare your metrics to published case studies or sectoral norms, but always adjust for your project’s unique context.
- Historical Data: Use your prior engagement data as a baseline for trend analysis and incremental improvement.
- Stretch Versus Realistic Goals: Set ambitious, but achievable, targets that foster growth but do not demoralise teams or disengage stakeholders.
Success Stories and Best Practice
When leading mining, construction, and public sector organisations consistently review their engagement metrics, they identify pockets of disengagement, innovate rapidly (e.g. introducing new digital participation tools or accessible forums), and embed a culture of responsive dialogue—ultimately unlocking better project and community outcomes.
—
Expert Tips for Actionable Stakeholder Success Measurement
1. Prioritise Stakeholder-Centric Metrics
Shift your focus from only reporting activity (“how many emails sent?”) to measuring stakeholder outcomes (“how many stakeholders felt heard or influenced decisions?”).
2. Use Multi-Modal Analytics
Go beyond raw participation counts by integrating sentiment, channel engagement, qualitative feedback, and repeat engagement analyses into your success framework.
3. Enhance Transparency and Accountability
Share results with stakeholders—transparently reporting performance against KPIs helps build trust, legitimacy, and ongoing goodwill.
4. Close the Feedback Loop
Publish “You Said, We Did” reports and celebrate visible action as a result of stakeholder input, reinforcing the impact of engagement.
5. Integrate Tools for Richer Data
Leverage engagement tools—such as surveys, Q&A forums, document libraries, and analytics—to gather multifaceted data, all consolidated into your stakeholder management platform.
—
Future Trends: The Evolving Landscape of Stakeholder Engagement Analytics
Emerging technologies are reshaping the landscape. Here’s what to prepare for:
- AI and Machine Learning: More platforms offer AI-driven insights, predicting emerging risks and opportunities through text analysis, sentiment scoring, and pattern recognition.
- Real-Time Dashboards: Stakeholder managers can now access live analytics, seeing feedback unfold and responding dynamically.
- Integrated Impact Measurement: Alignment between internal business outcomes and external stakeholder benefit (such as alignment with ESG or community wellbeing targets) is becoming a new KPI standard.
To stay ahead, consider platforms like our Stakeholder Management Software, which offers tools built specifically for comprehensive stakeholder data and analytics management, supporting both present and future needs.


